Jurian Baas

Designer and creative technologist at the City of Amsterdam's AI Lab. I research, design and build prototypes, from user interviews to working code.

I build to put ideas in front of people. A working prototype answers questions a wireframe can't, and shows whether you're on the right track.

At the AI Lab we explore where AI can do good for the City. I build the prototypes that make that exploration concrete: how AI can help residents and public servants, and what role the City should give it. I design and build the frontend. AI specialists on the team build the backend, and on smaller projects I do that myself. I also coordinate the AI subgroup of the City's design guild, where we discuss what AI means for our craft.

I like building tools for people whose work I understand, designers most of all. Before the AI Lab I was a technologist in a design research team, working on affordable housing, the energy transition and accessibility. My background is in political science, web design, copywriting, UX research and data visualization.

Email me at jur@jurian.me.

Selected projects

Subsidiemaatje prototype screenshot

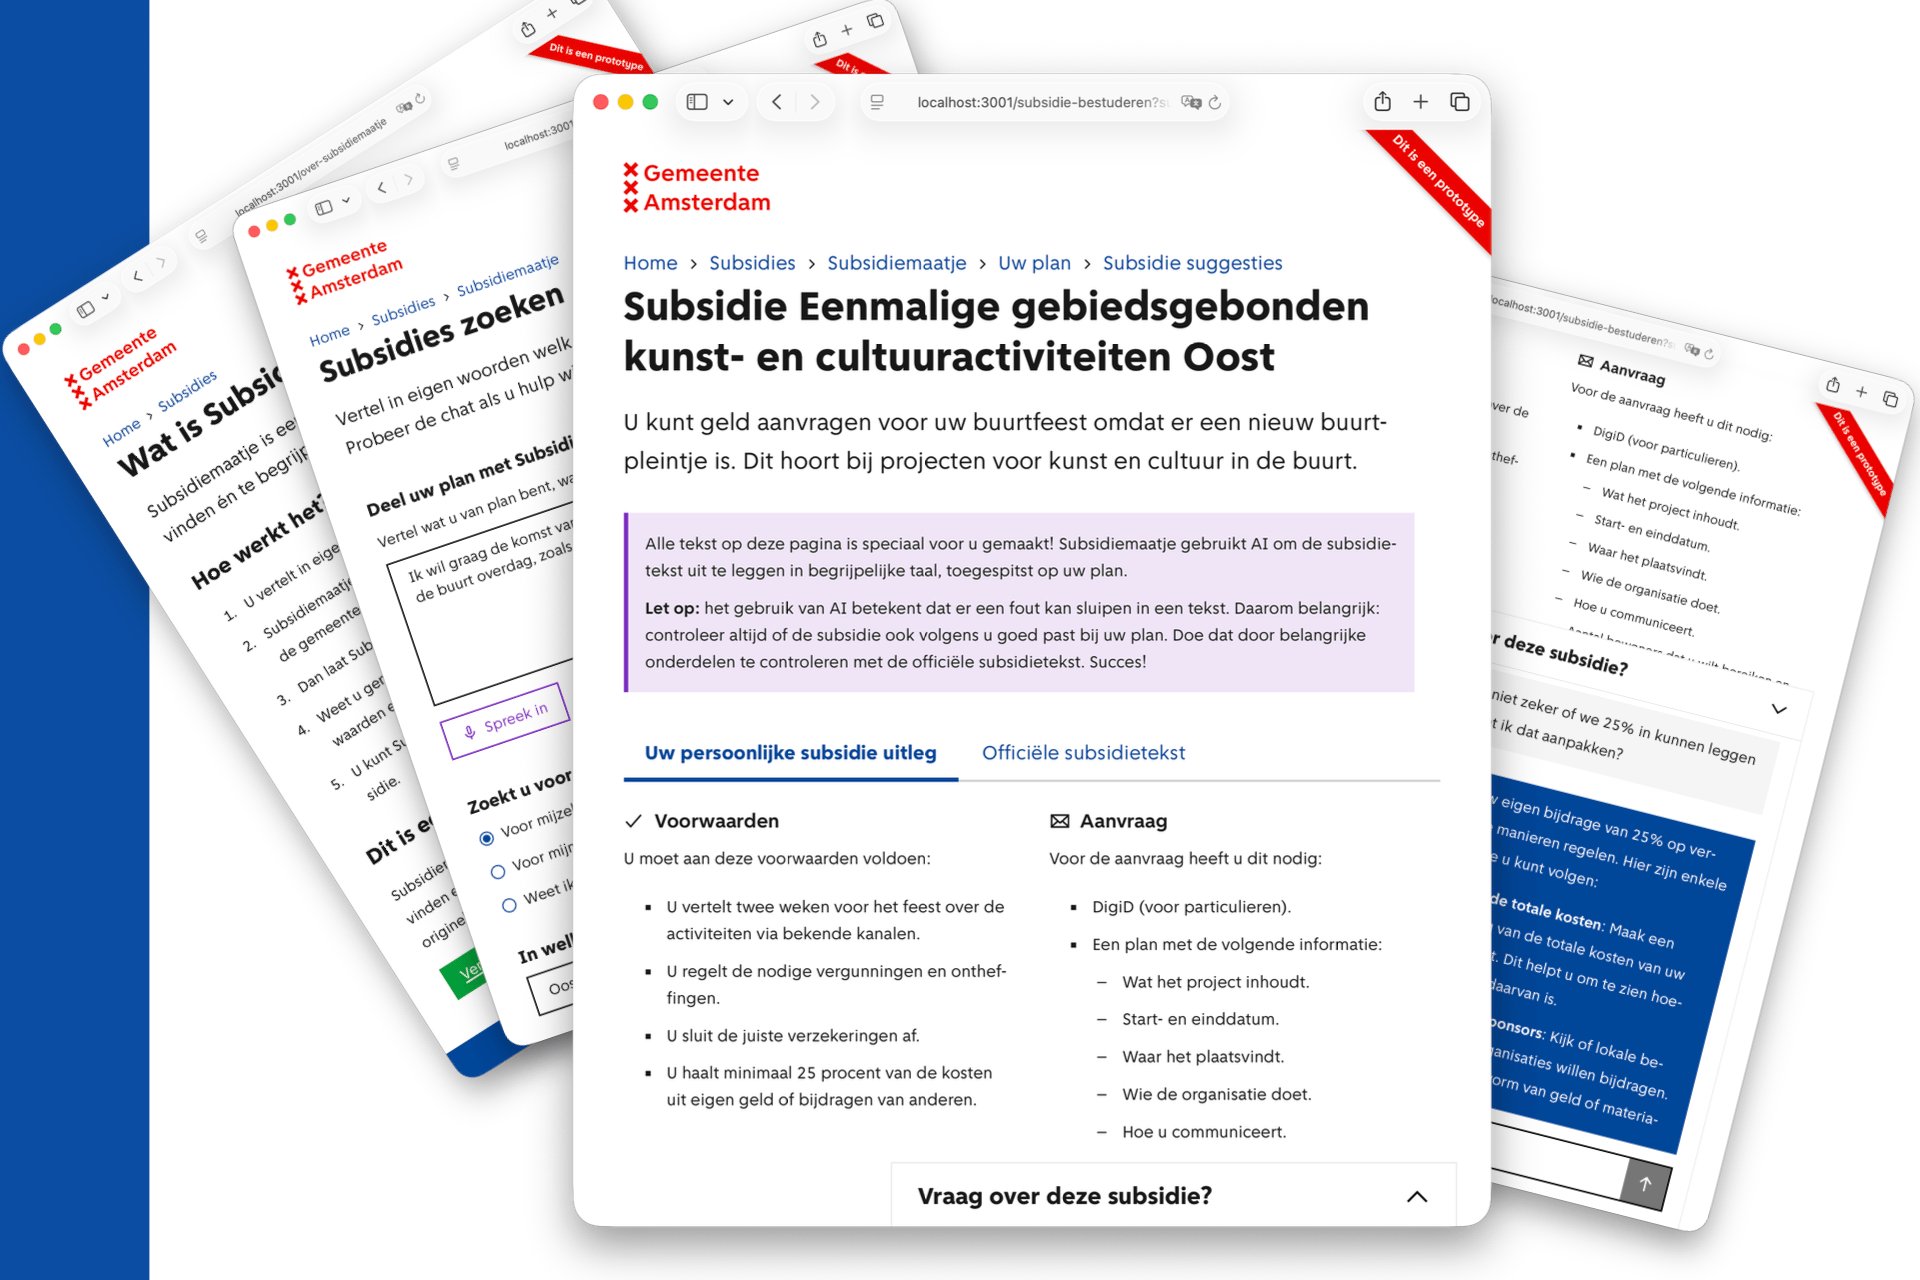
Subsidiemaatje

AI prototype for the City of Amsterdam

  • AI prototype that helps Amsterdammers find, choose and understand the city's ~100 subsidy schemes. Built at the Amsterdam AI Lab in Q4 2025 for directie SIS (Subsidies, Inkoop, Juridisch Bureau Sociaal).
  • Preceded by a three-month discovery phase: stakeholder interviews, a RAG-based question-answering tool over the subsidy texts, and a Figma prototype tested with users.
  • Designed and built the Next.js frontend on the Amsterdam Design System: the AI-element UI language and the side-by-side “personal explanation / official source text” pattern that keeps the legal regulation one tab away.
  • Wrote a custom amsterdam.nl scraper, now whitelisted by the city's web team, that feeds the RAG layer with up-to-date regulation text for all 100+ schemes.
  • An AI specialist built the Flask backend, the LLM pipelines and the synthetic-recall eval (5 fictive cases per regulation across 99 schemes).
  • Tested with Amsterdammers; most found subsidies faster than via Google or amsterdam.nl and felt more confident in their choice. Code open-sourced; classified as low-risk AI by the city's Digital Strategy directorate.
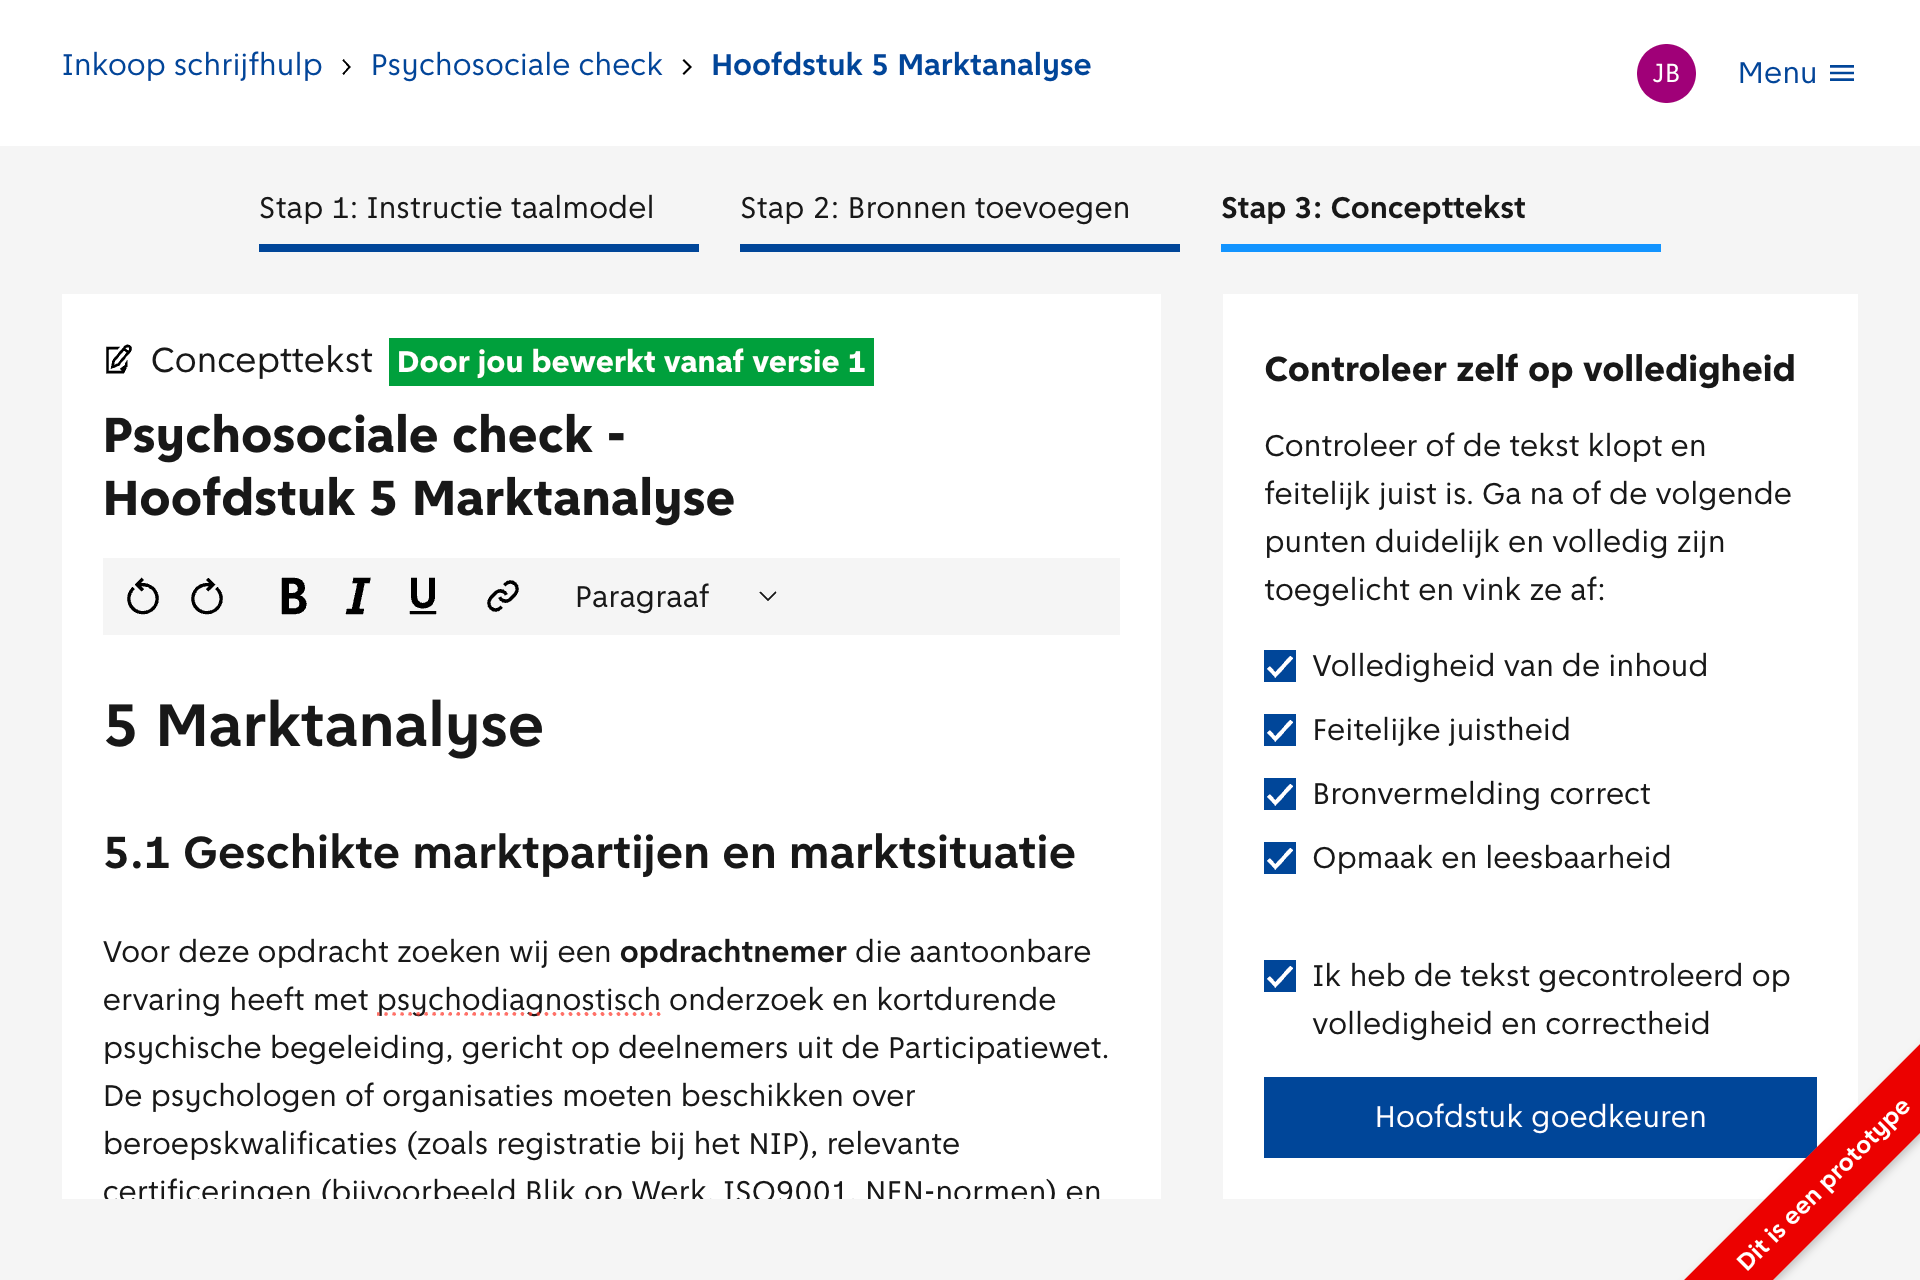
Inkoop Schrijfhulp prototype screenshot

Inkoop Schrijfhulp

AI prototype for the City of Amsterdam

  • AI authoring environment that helps Amsterdam's procurement advisors write inkoopstrategieën. Built at the Amsterdam AI Lab in Q4 2025 for the same client as Subsidiemaatje.
  • Architected the three-level prompt hierarchy (project / document / chapter) that lets one engine support different writing tasks, teams and document types.
  • Designed and built the Next.js frontend: a chapter editor with auto-save and version history, a human-validation checklist that gates chapter approval, and admin/template UI. Extended the FastAPI backend and PostgreSQL schema to fit the hierarchy.
  • Tested with procurement advisors in three sessions; they self-reported time savings from 50% up to 2–3 working days per inkoopstrategie, and all wanted to keep using the tool.
  • Co-built with an AI specialist: the Azure OpenAI integration and the autonomous web-search agent (browser-use + Playwright). Code open-sourced.
AI Futures prototype screenshot

AI Futures

Speculative AI research for the City of Amsterdam

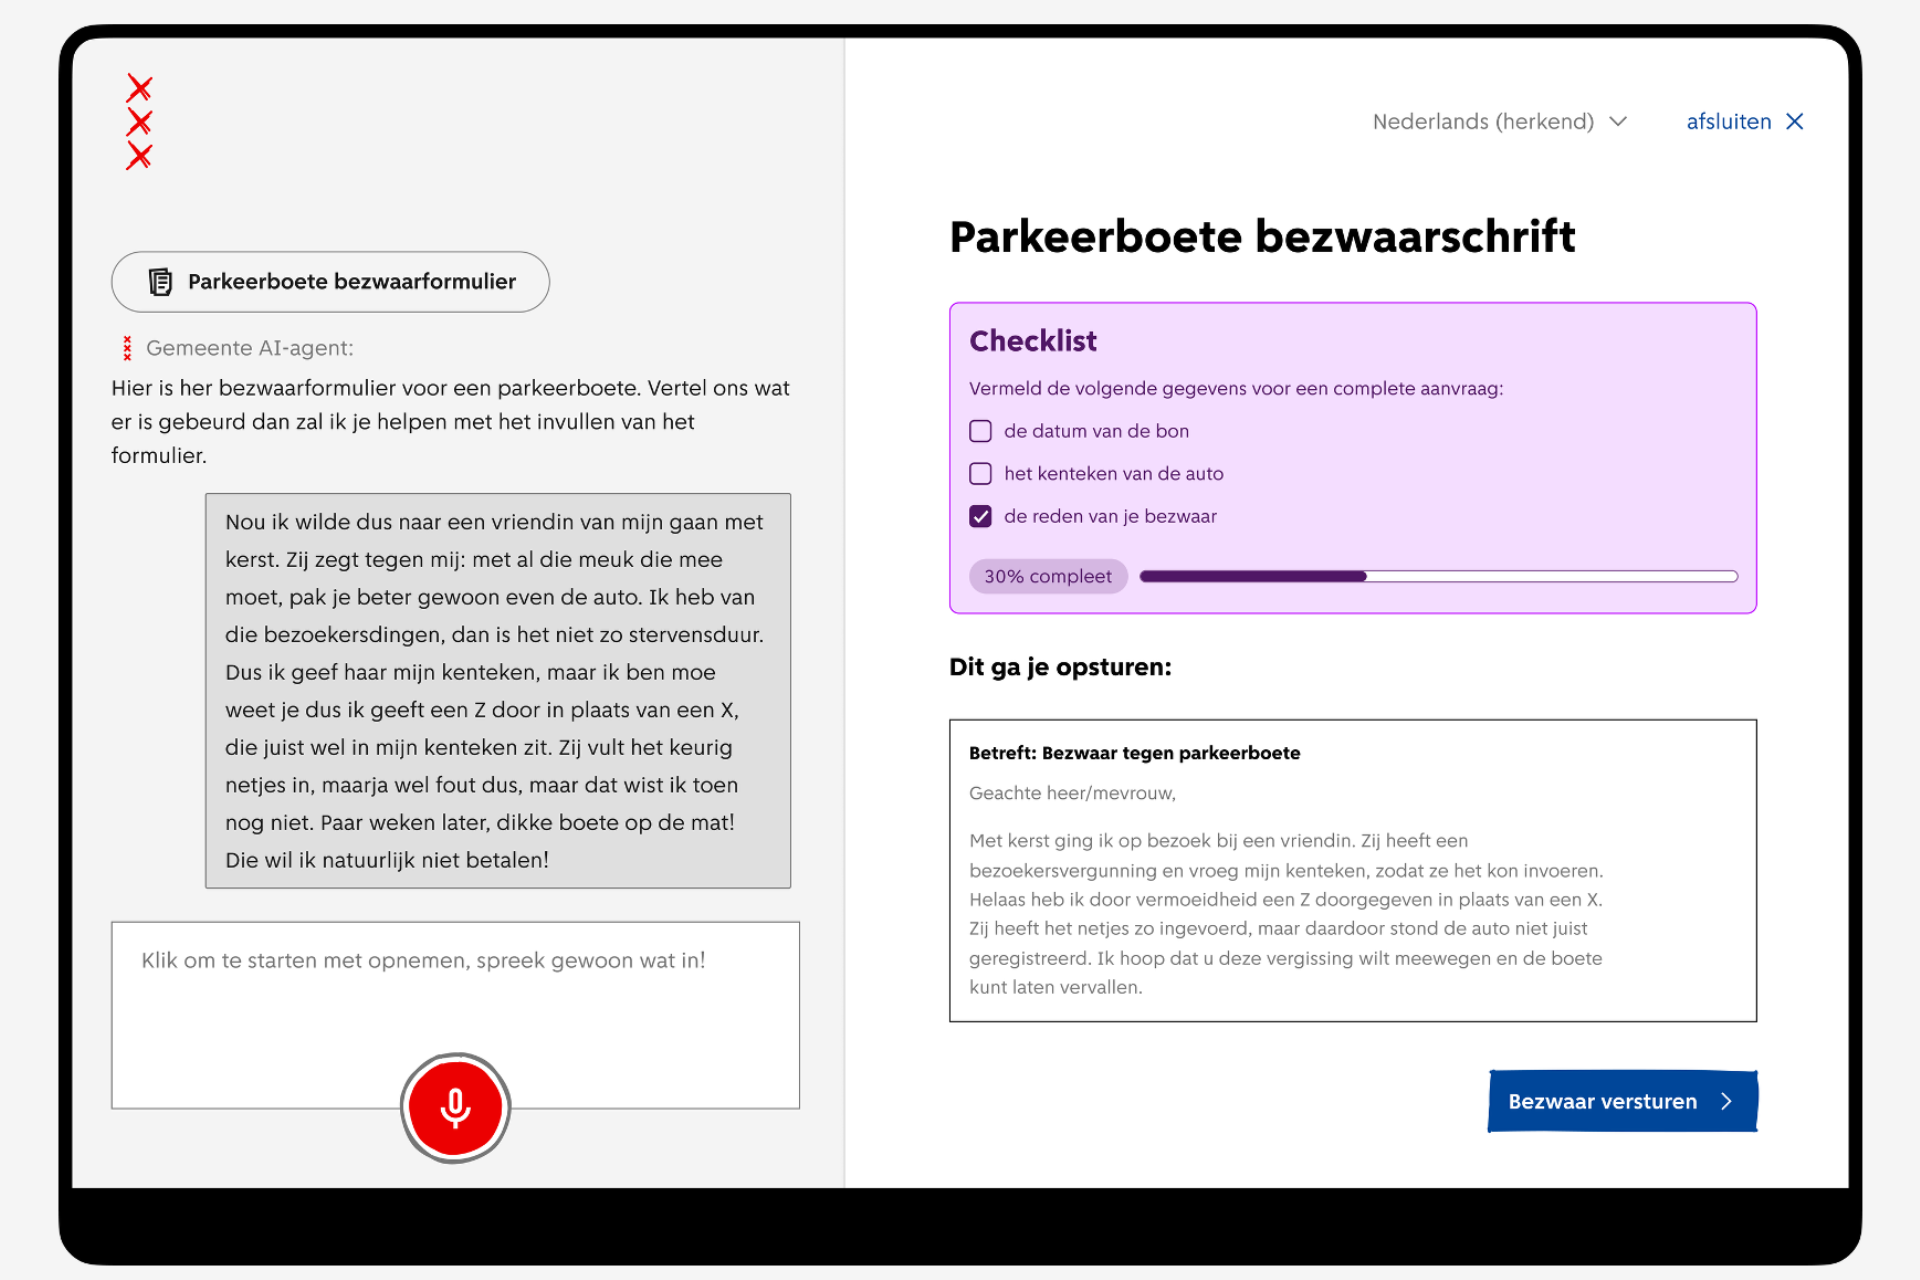
  • Speculative research at the Amsterdam AI Lab in 2025, for directie Dienstverlening, exploring two futures for municipal services: AI quietly supporting civil servants, and residents delegating tasks to their own AI agent that negotiates with the city.
  • Co-designed the prototypes and built the SvelteKit frontend, including an i18n layer that detects the spoken language and switches the UI to match.
  • Co-built with AI specialists and another designer: the LLM pipelines (Azure OpenAI, GPT-4.1) behind both scenarios.
  • Use cases tested: contesting a parking fine and applying for a neighborhood event subsidy.
  • Demoed at the World Summit AI by Innovation lead AI Swaan Dekkers.
AI and Design blog post header

AI and Design talk

Lead of the AI & Design chapter of the design guild

  • I lead the AI and Design subgroup of the City of Amsterdam's design guild, helping designers build a shared understanding of AI in their practice.
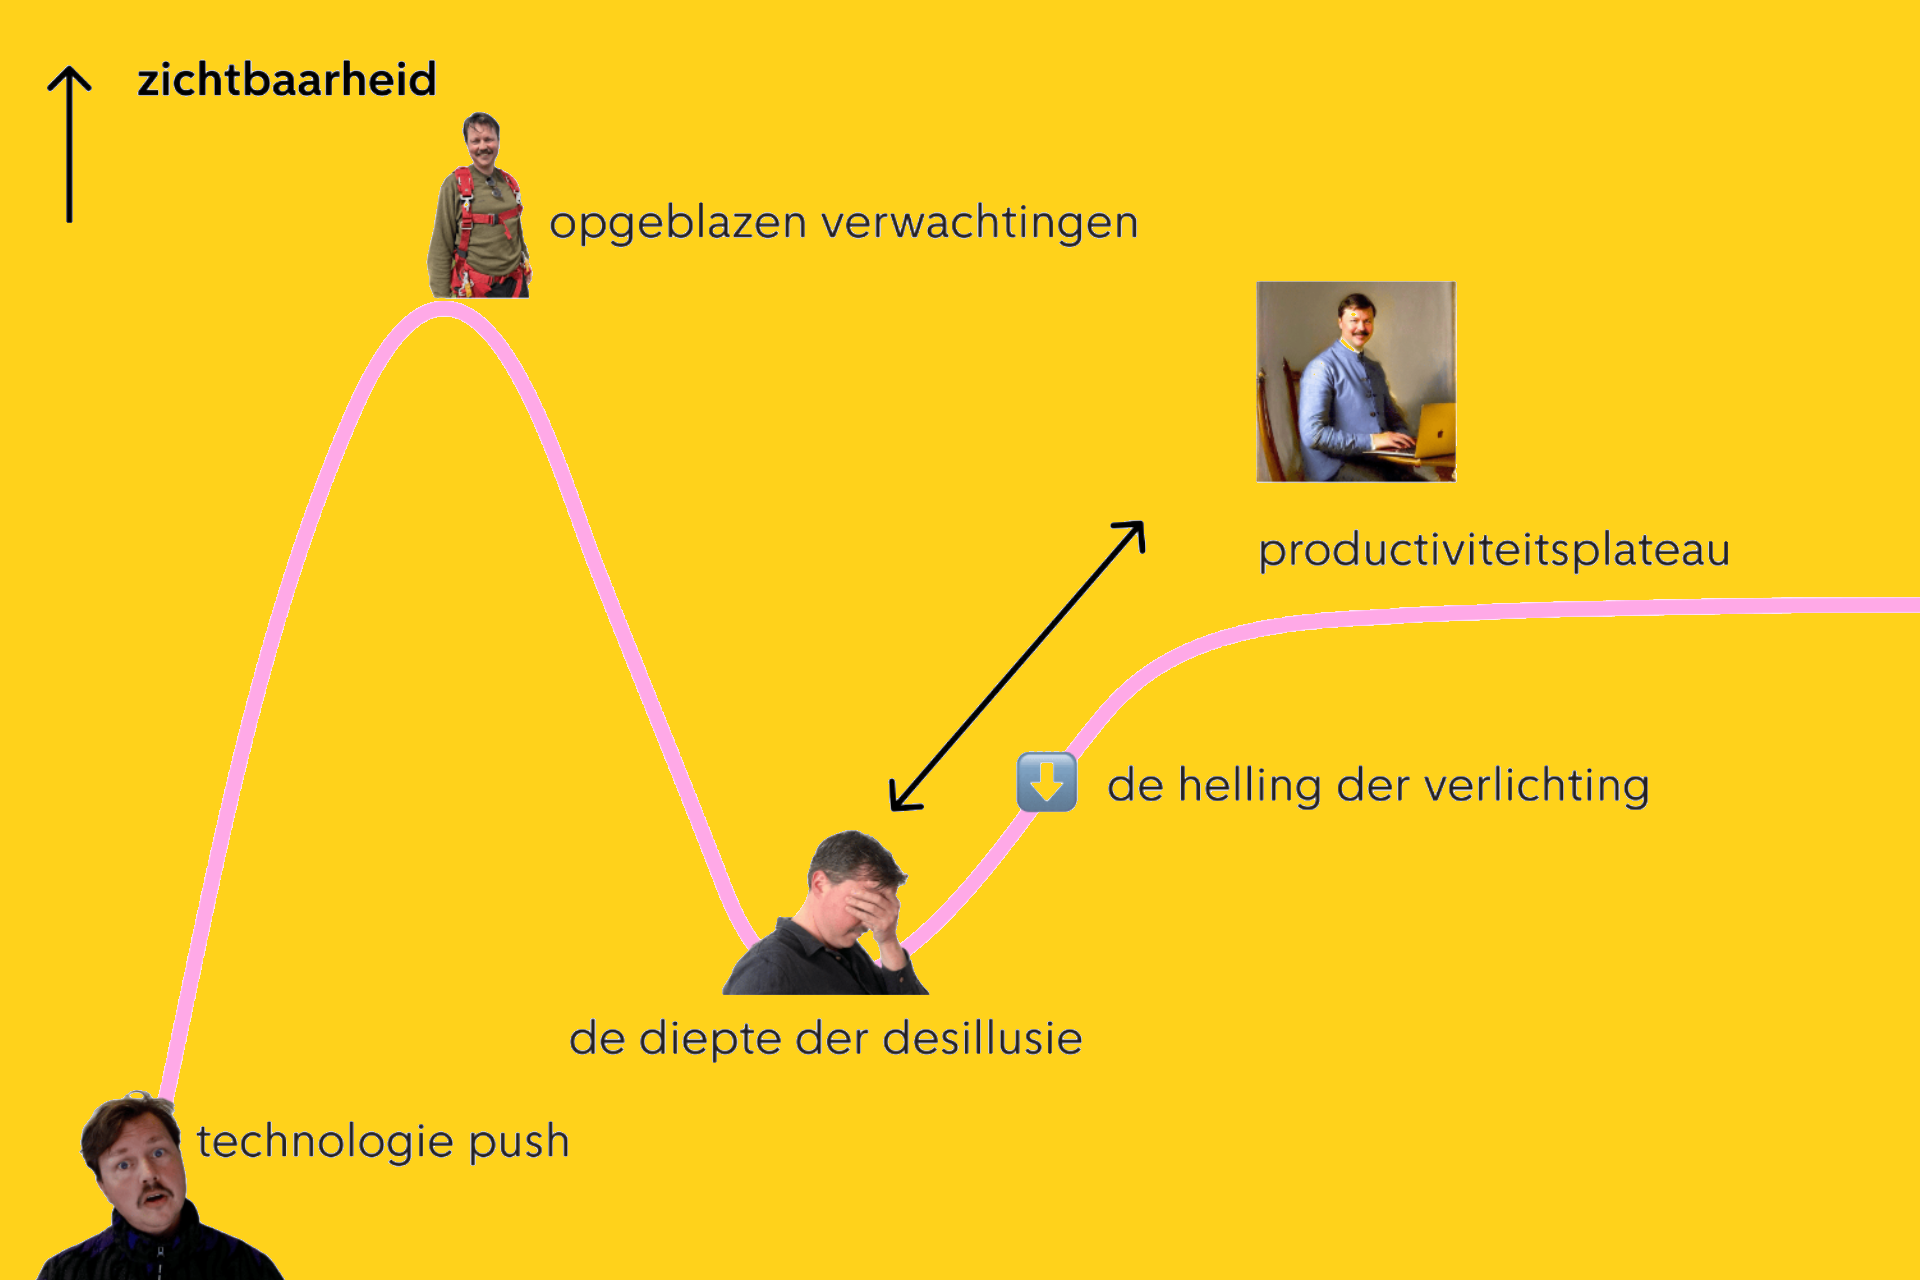
  • Kicked off with a talk on what AI means for design work, published as a blog post.
  • Follow-ups so far: a session with Wietse Hage and a workshop on the ethics of AI in design.
  • Currently writing design principles for two contexts: building products that contain AI, and living in a society where AI gains influence.
Brainstormhulp ideation tool screenshot

Brainstormhulp

AI ideation tool for the City of Amsterdam

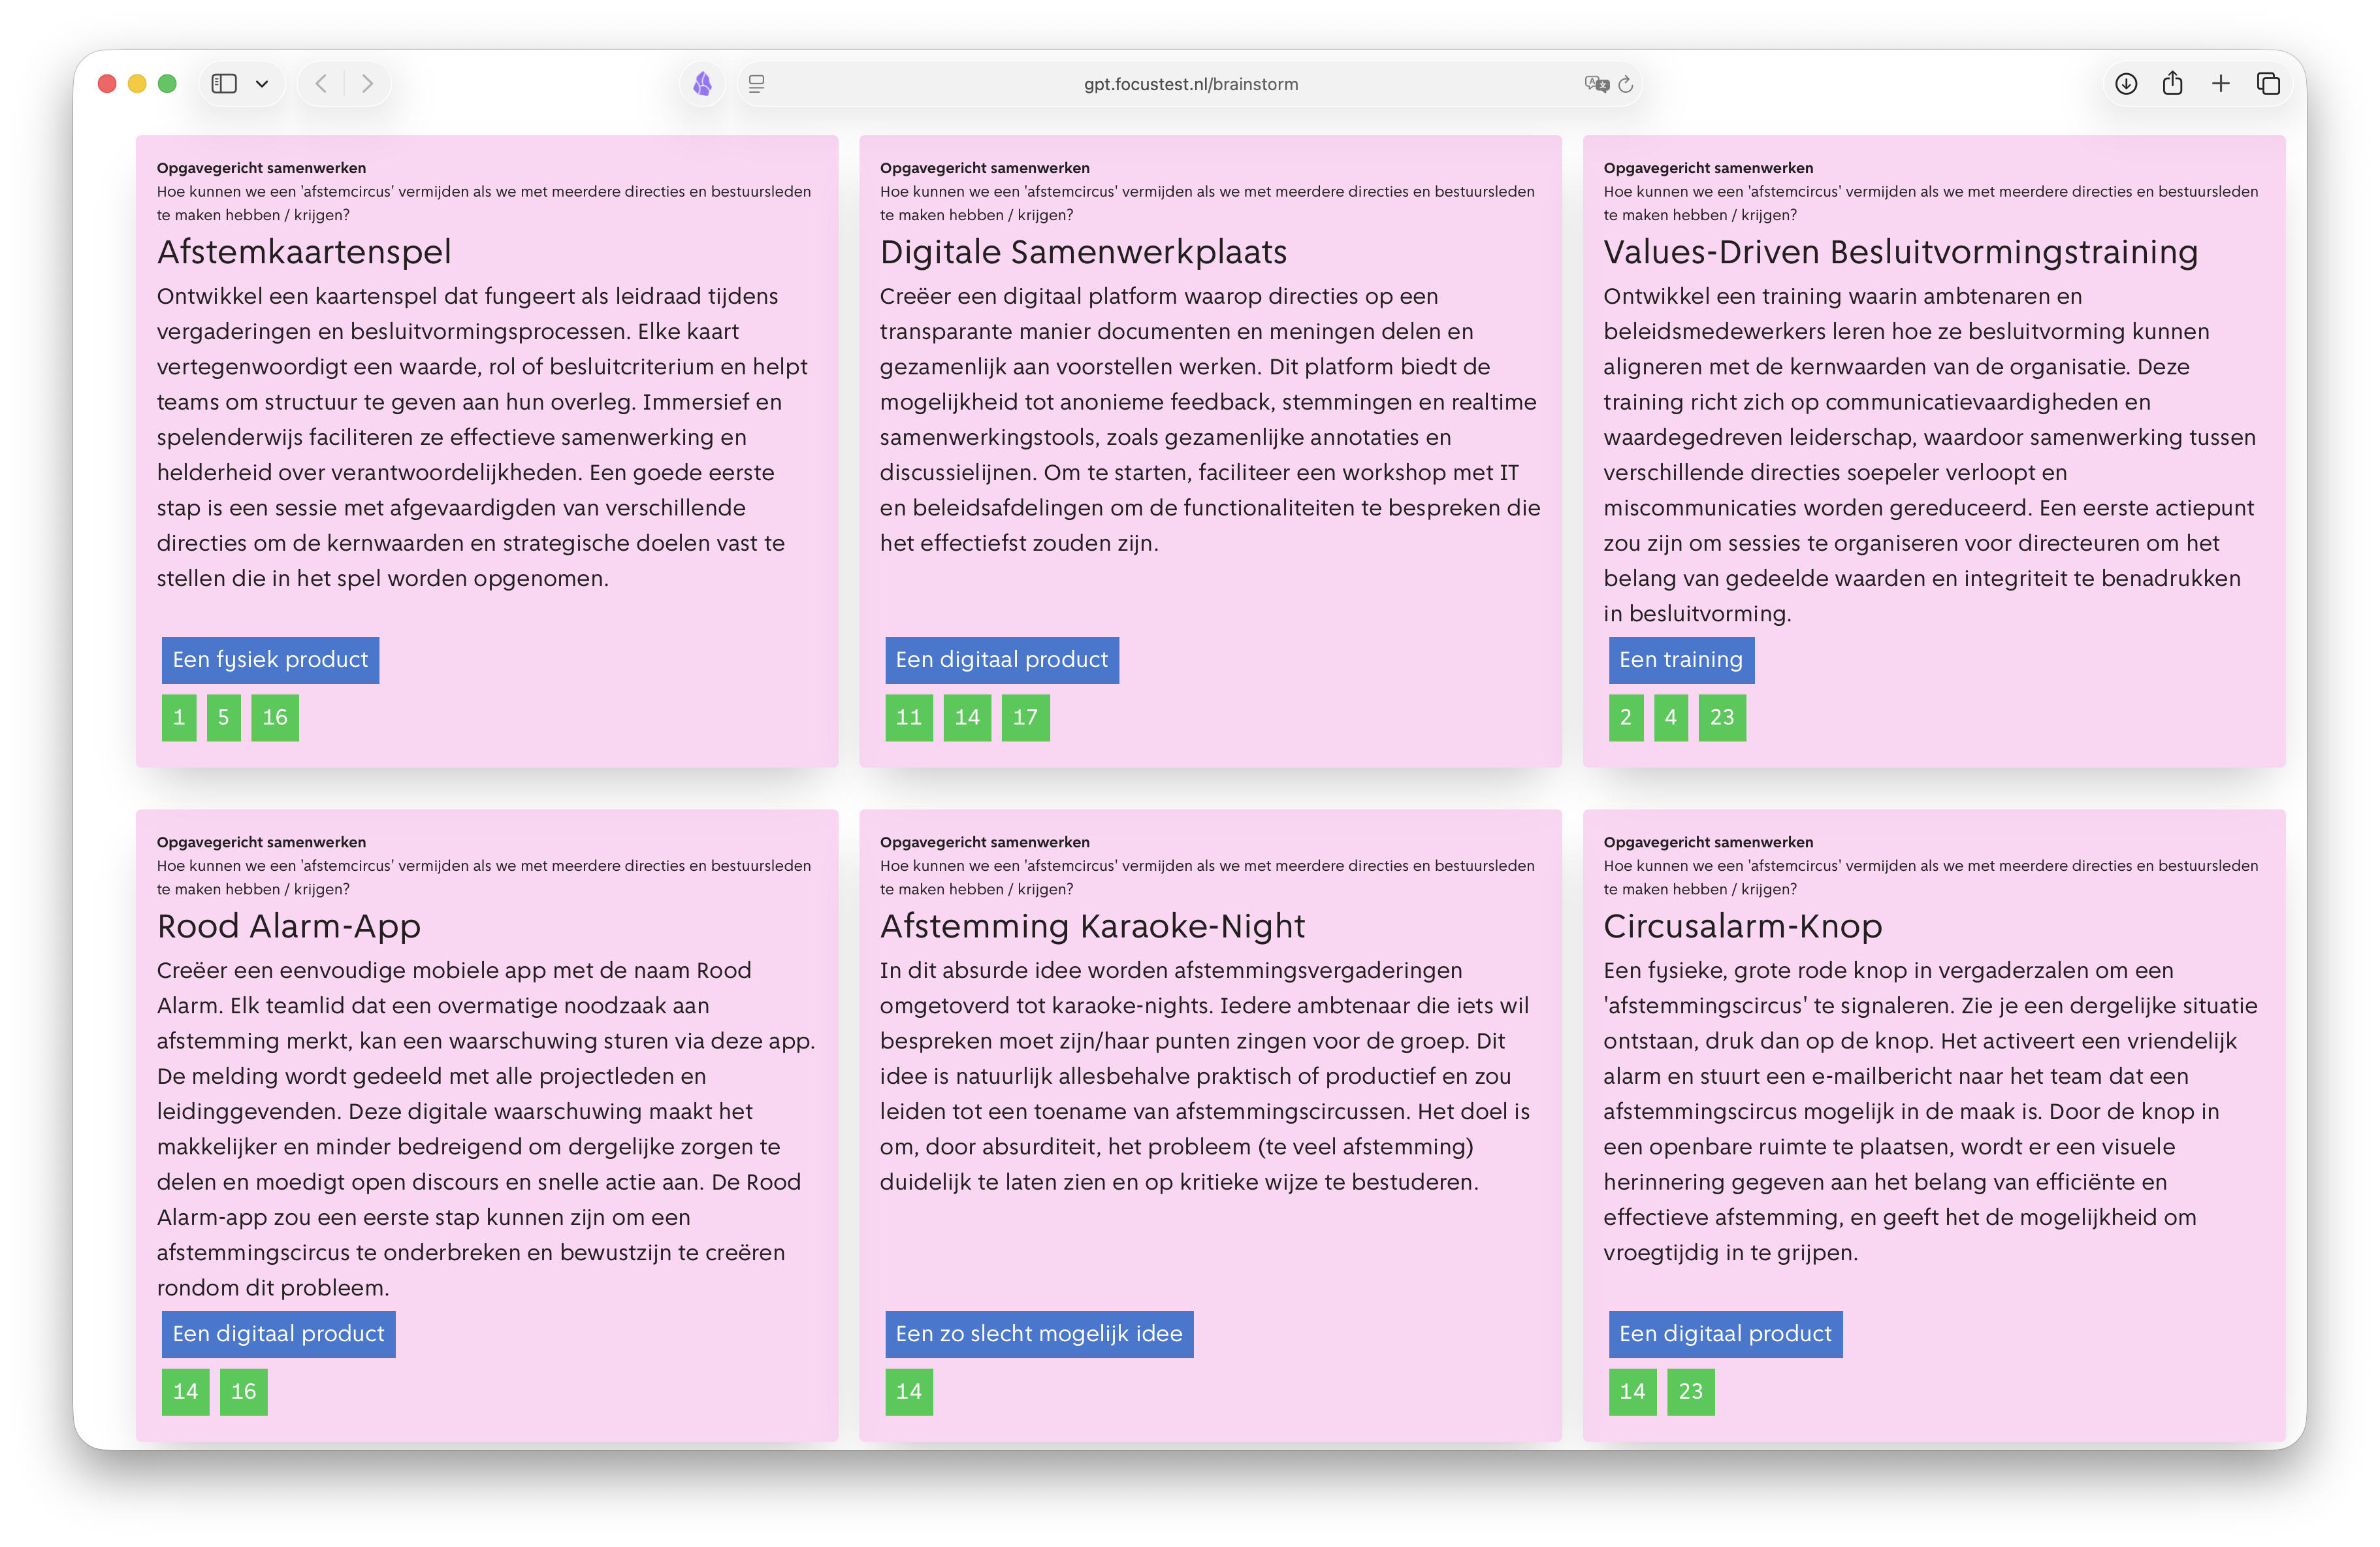
  • Ideation tool that brainstorms ideas from How Might We questions, using quotes from user interviews as extra context for the model.
  • Pick a form to brainstorm in and see which quotes back each idea.
  • Designed and built end-to-end; used in an ideation session with policymakers.
Ontwerpen van Vertrouwen workshop screenshot

Ontwerpen van Vertrouwen

Workshop tool for the City of Amsterdam

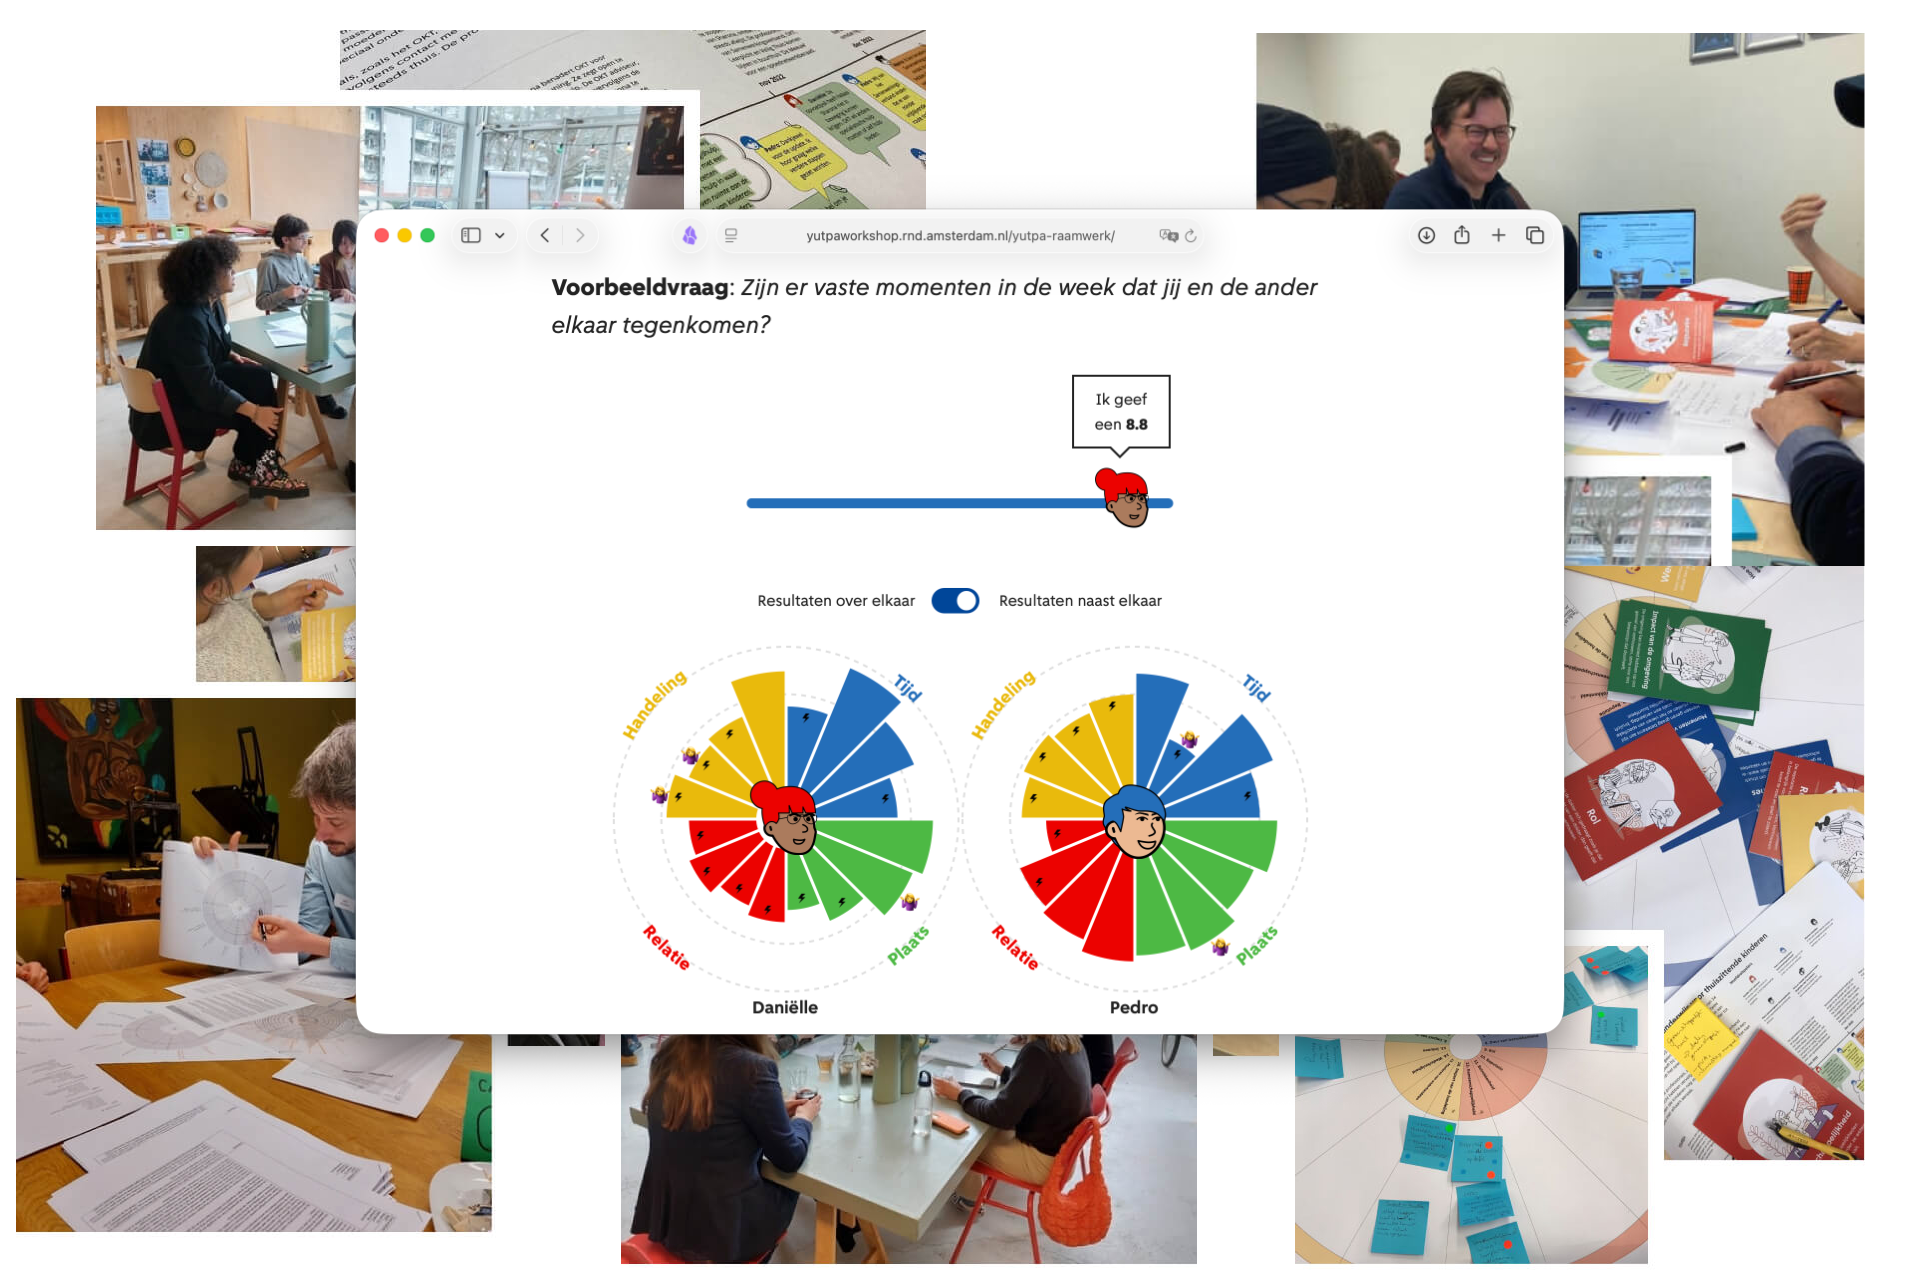
  • Interactive workshop that helps civil servants reflect on citizen-government interactions using the YUTPA trust framework, which in raw form demands too much of facilitators and participants for daily use.
  • Designed and built a workshop format that guides facilitators and participants through every step on screen: individual input beforehand, structured group discussion, and concrete next actions, with printed materials in support.
  • Aim: make citizen-government communication more conscious and contribute to mutual trust.
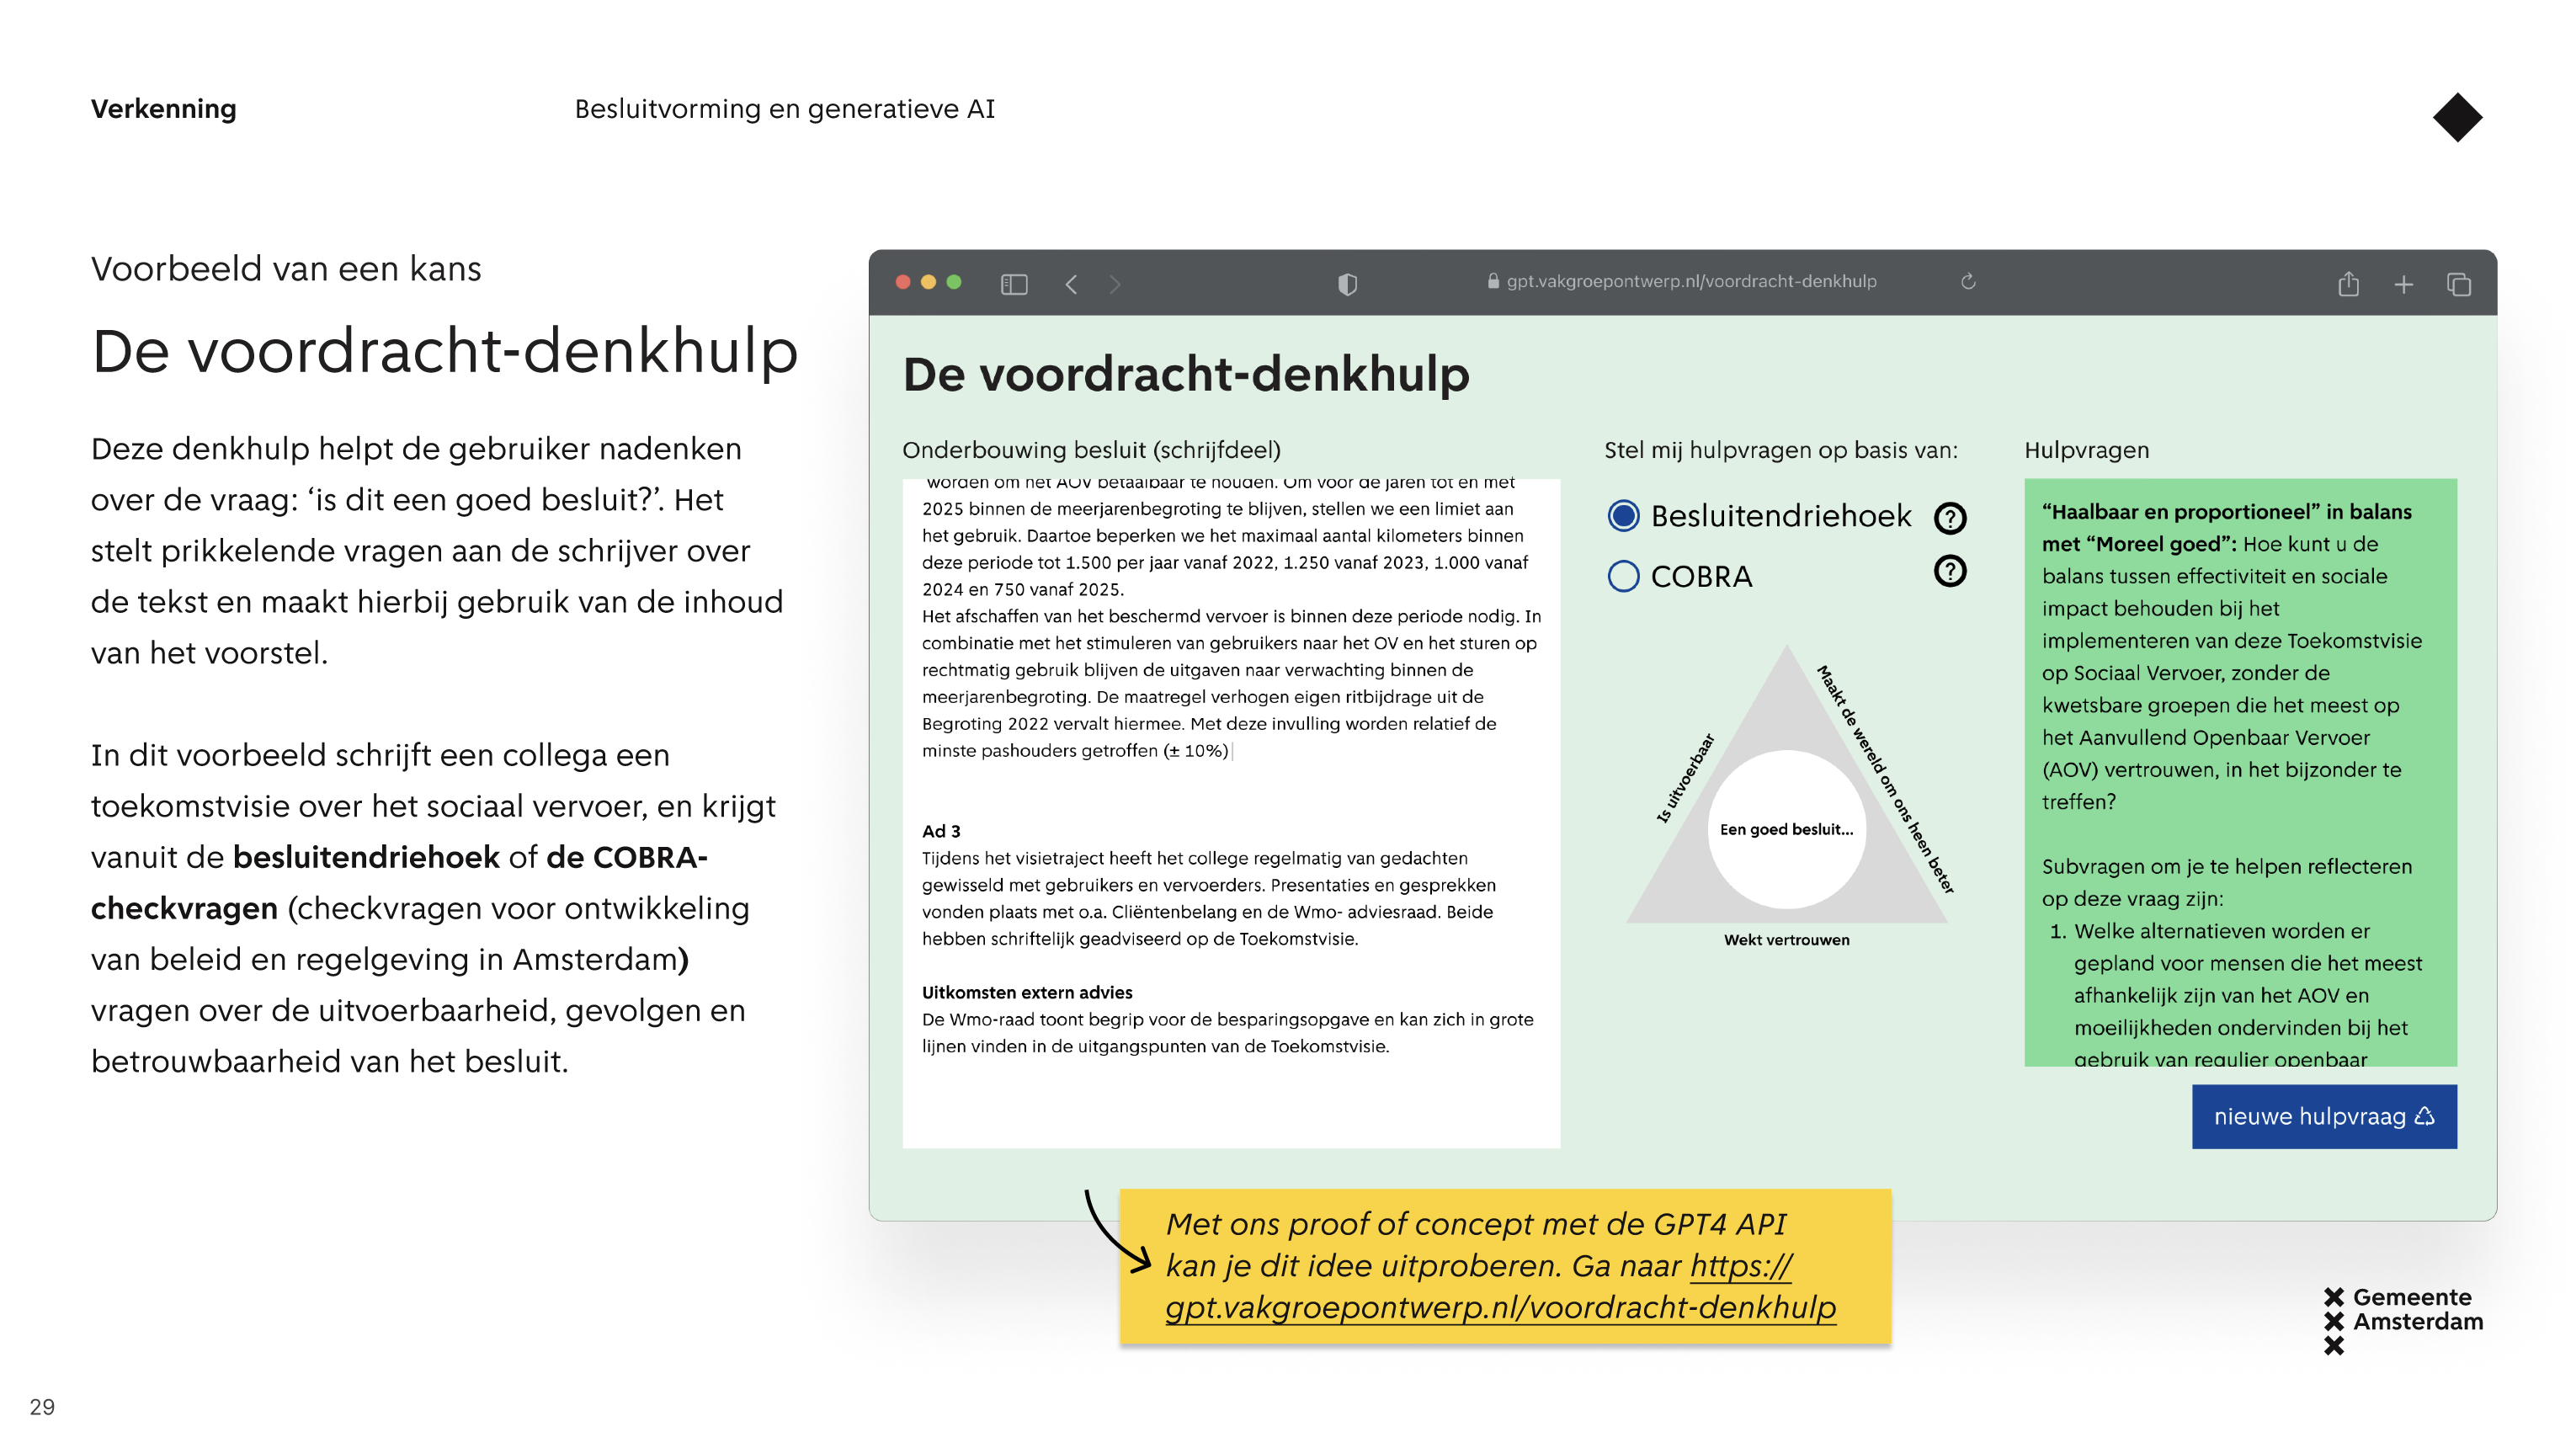
Generative AI in policy slide deck

Generative AI and policy

Opinion piece with working prototypes

  • Opinion piece on how generative AI can both help and harm policy work.
  • Examples: a 'document thinking help' that supports the writer's reasoning (helpful), a 'document fixer' that replaces it (less helpful), and an autogenerator of city council questions (damaging).
  • Most examples come with a working prototype, so the arguments are about tools you can actually try.
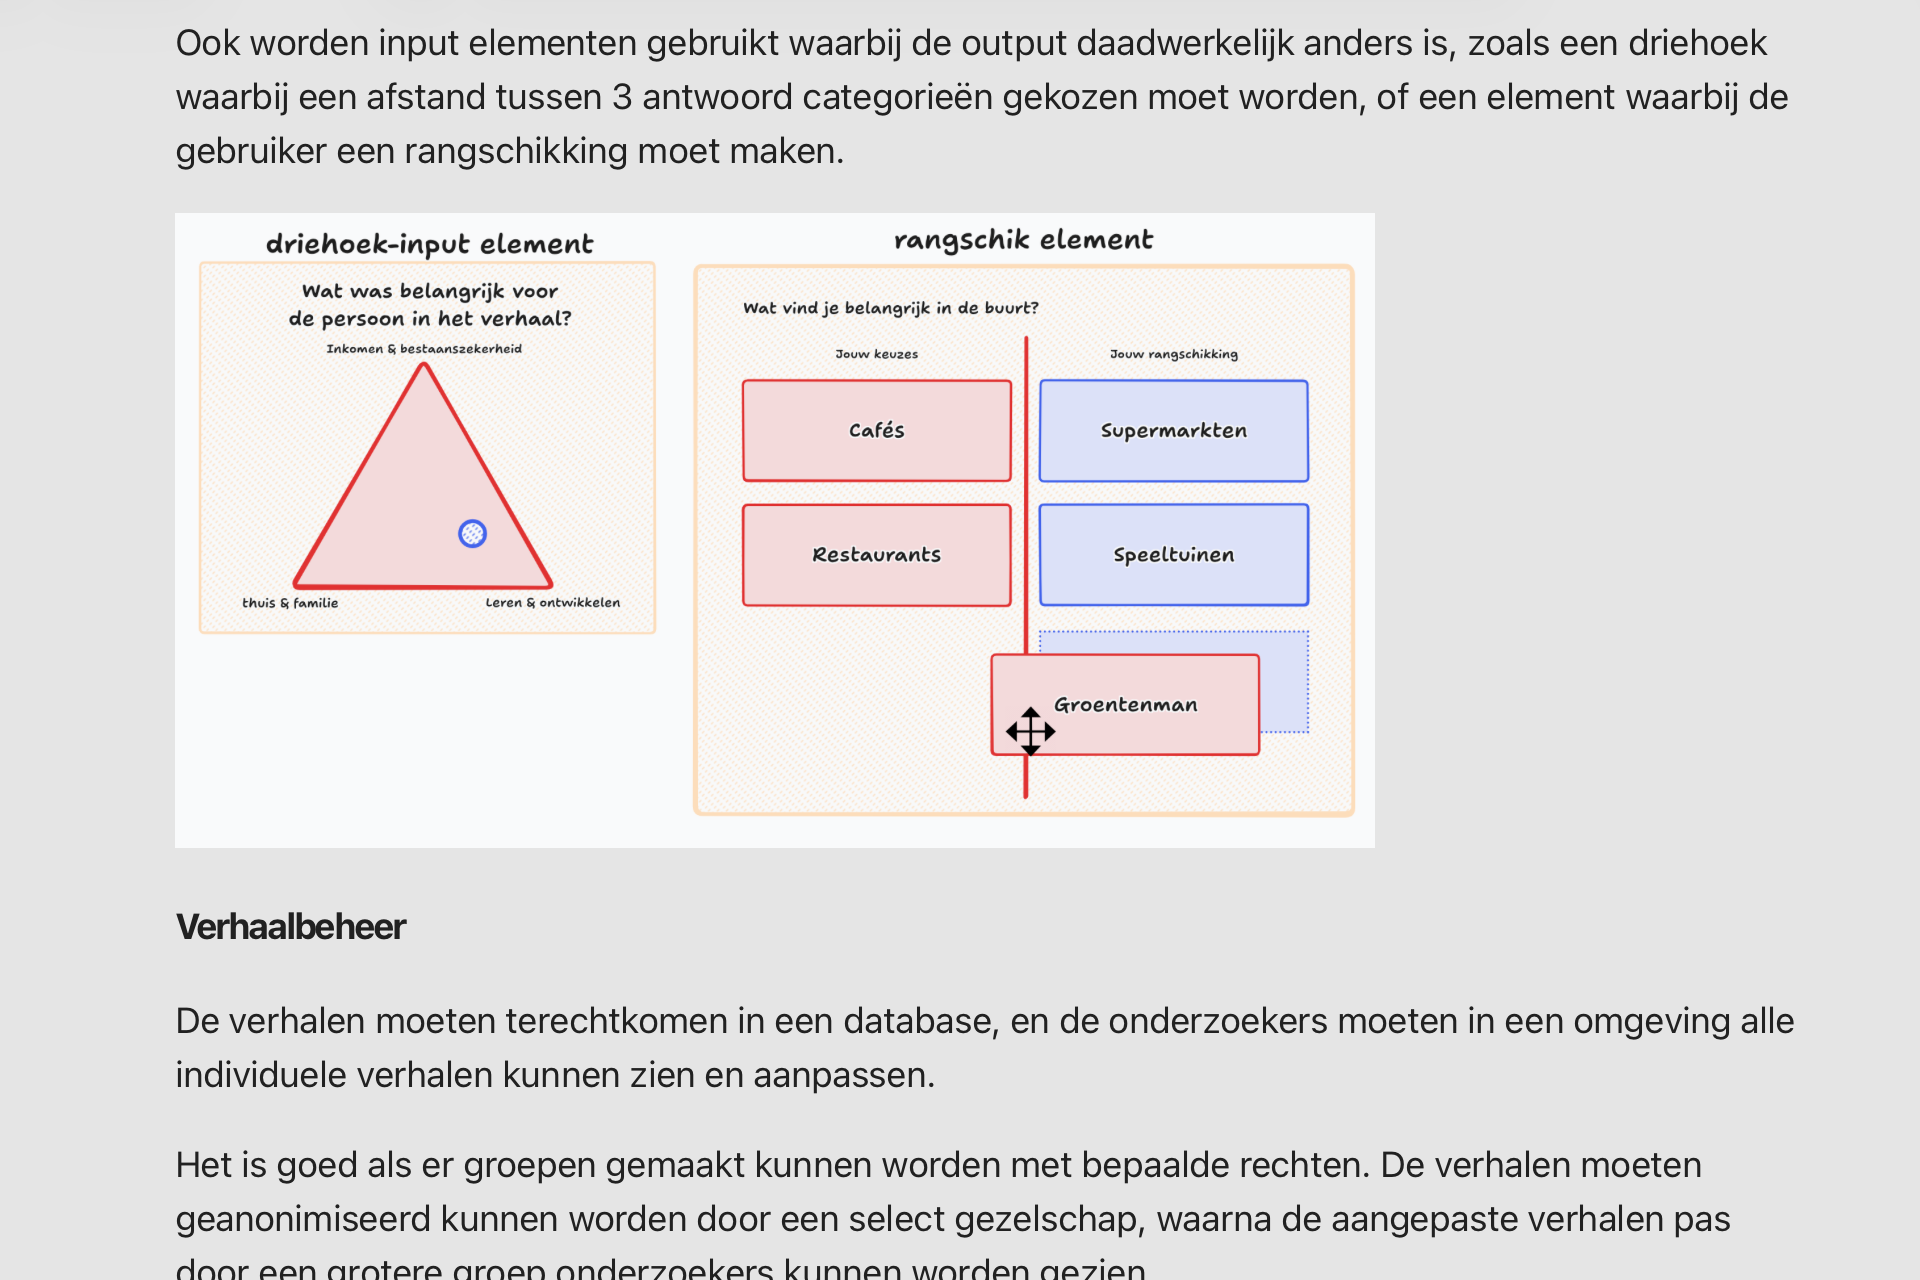
PNI software design document

Software for Participative Narrative Inquiry

Software design document

  • Participative Narrative Inquiry (PNI) is Cynthia Kurtz's research method that uses experience stories to make sense of complex situations.
  • Wrote a design document for software to support the method: UI sketches, cost mapping, vendor comparison, and what a from-scratch build would take.
  • Goal: a clear basis for deciding whether to buy, build, or assemble from existing tools.
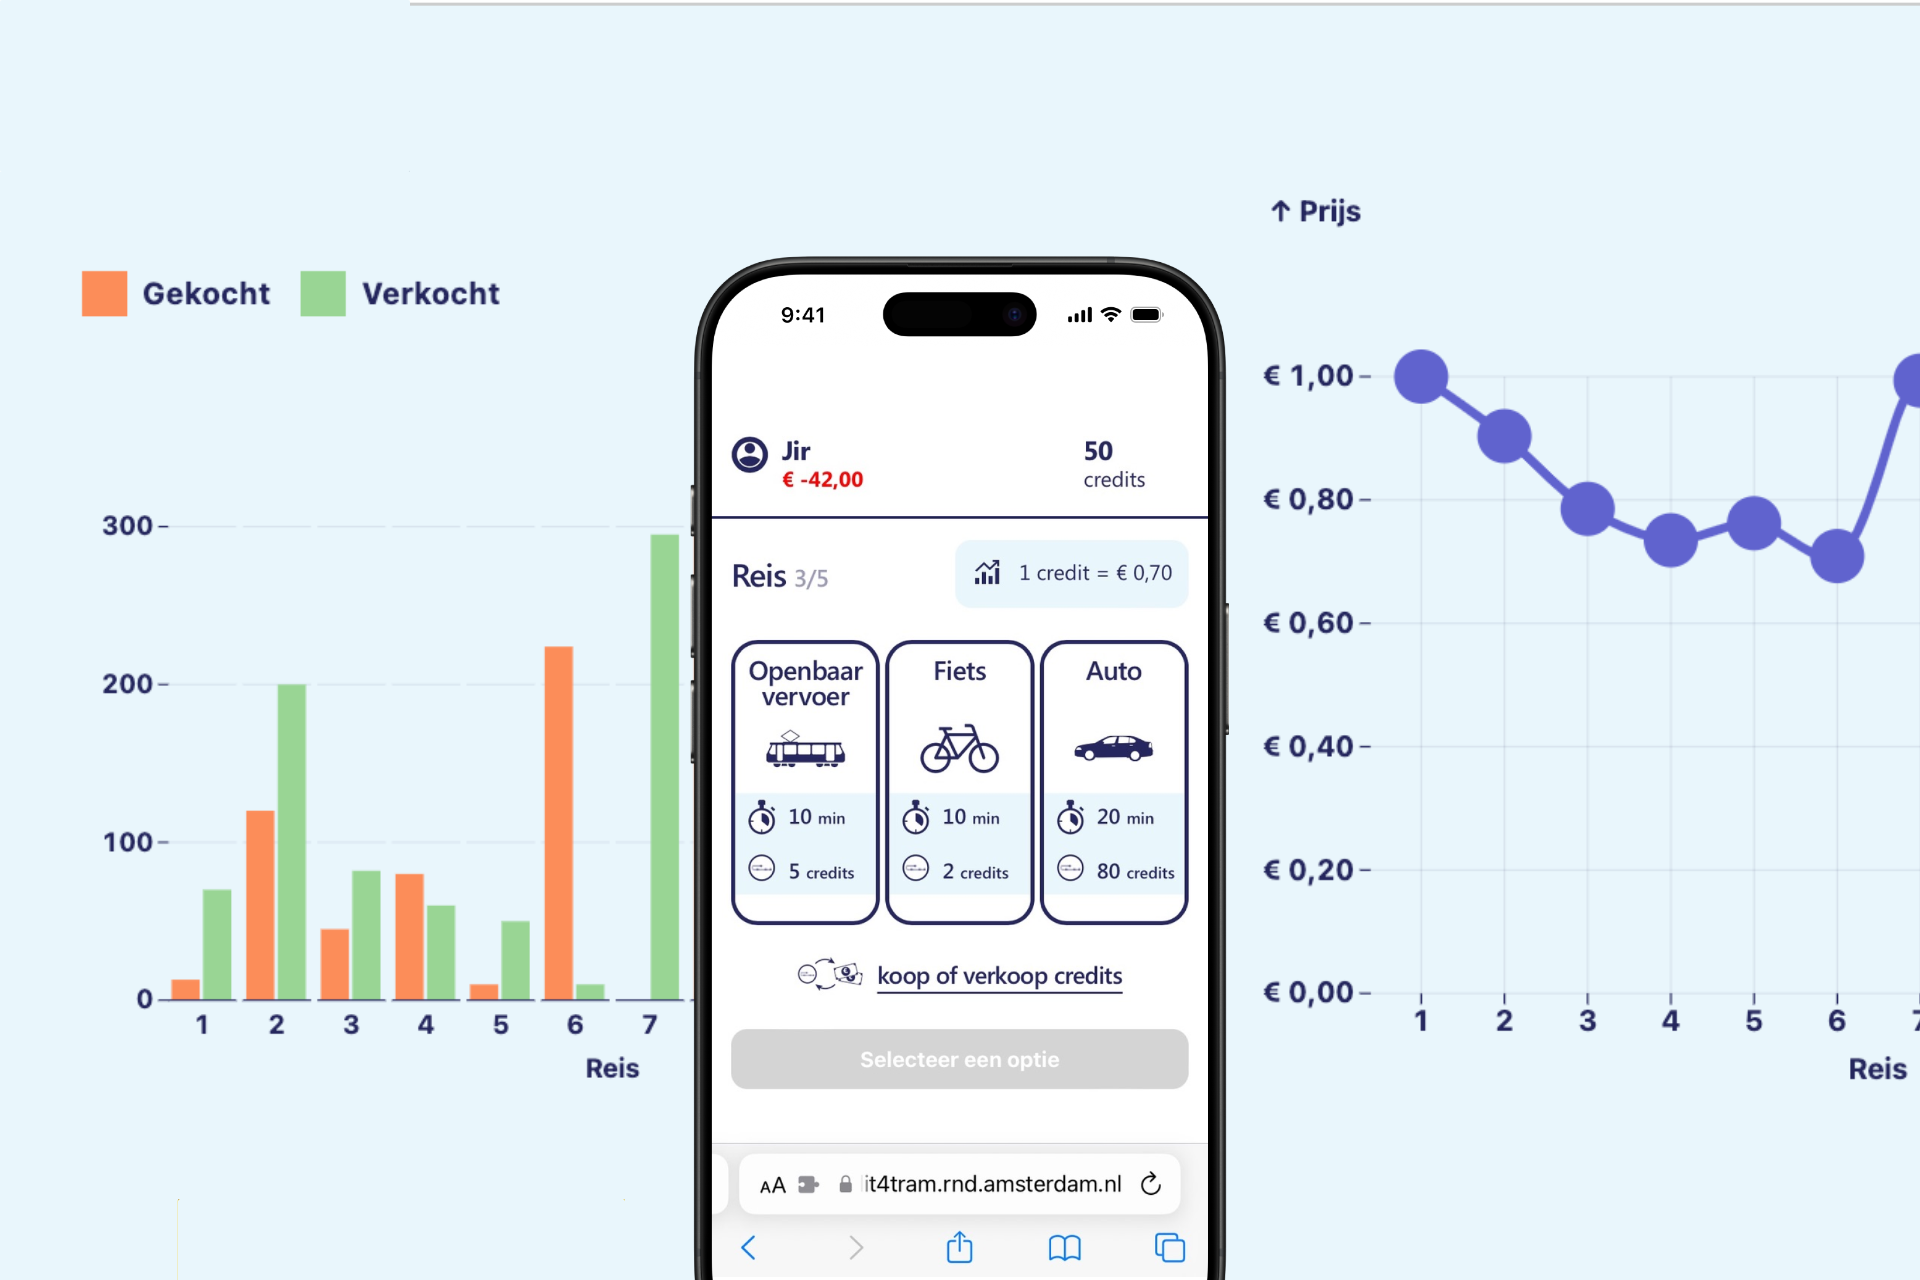
Credit-trading game screenshot

Mobility credit-trading game

Live game for a TU Delft mobility research group

  • Live, Kahoot-style game around a dynamic credit-trading mechanic, for a TU Delft mobility research group. Players joined from their phones while realtime trading was projected on the room's screens.
  • Designed and built end-to-end (SvelteKit frontend, PocketBase backend, realtime event handling), deployed on RND servers.
  • Played at 'Mobiliteit als schaars goed' at Pakhuis de Zwijger by a room of about 50 participants.
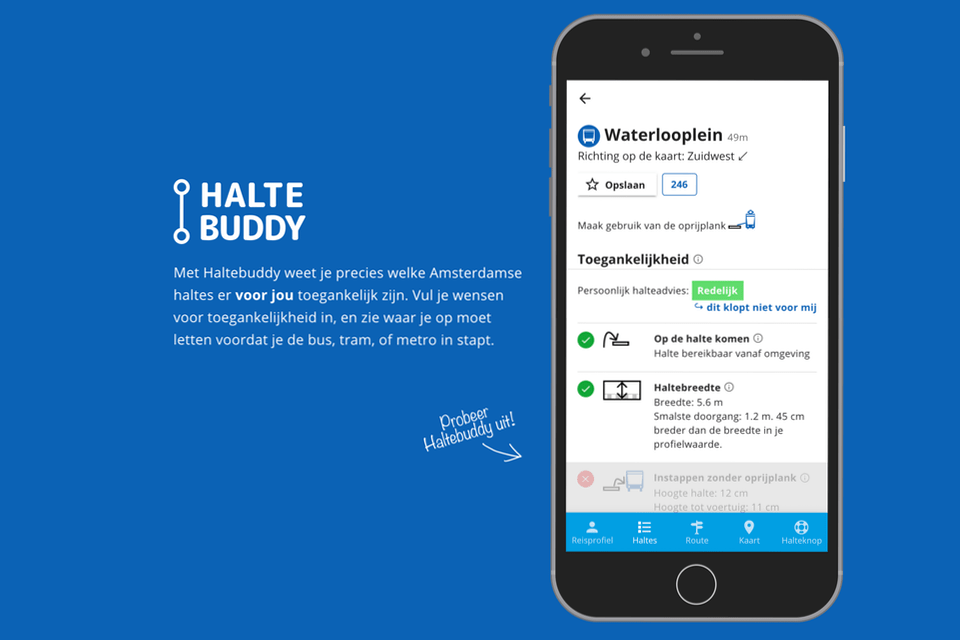
Haltebuddy mobile prototype screenshot

Haltebuddy

Prototype, shipped into the GVB app

  • Before we built the prototype we interviewed many people by showing them Figma screens and an Observable notebook. We also designed and tested the scoring function of the public transport stop completely in the notebook. This separation of concerns is a keeper!
  • Prototype to prove information on public transport can be personalized according to the needs of people with a motor disability.
  • The prototype works with real, current data and is designed to be accessed as a web application on a mobile phone. Made with Vue and Vuetify.
  • Made together with Cliëntenbelang Amsterdam, GVB, and VRA.
  • We also made an observable notebook with interactive documentation for the team that is going to adapt parts of the prototype.
  • GVB integrated the functionality into their app as 'Haltehulp' after two code review sessions in which their developers rewrote the prototype for production: the maker-to-maker handover I had hoped for. Presented at Inclusive Mobility Lab 2021 to push for national adoption.
Dashboard for unnamed client

Interconnected graphs and maps

Dashboard

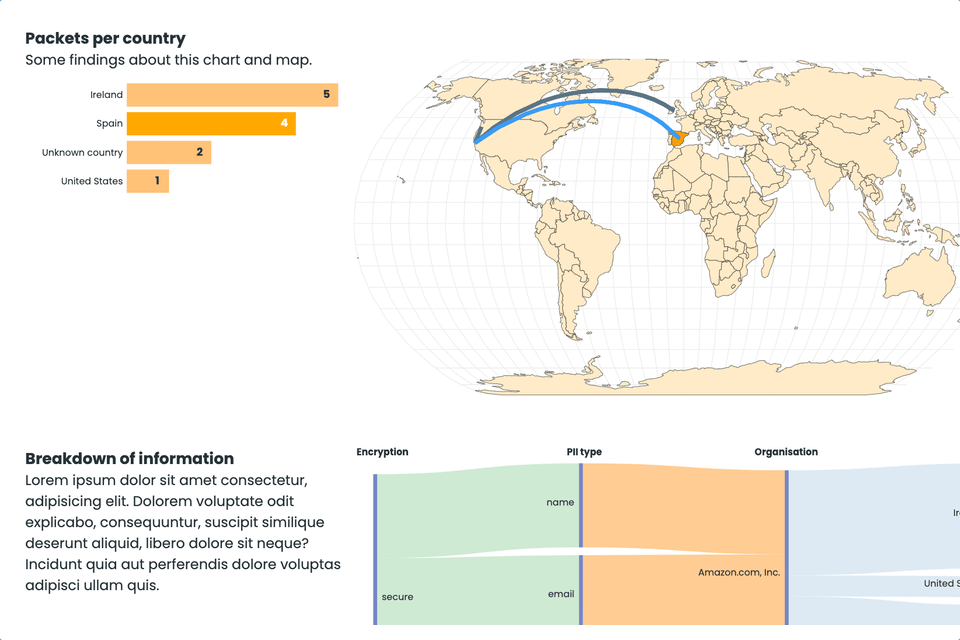
  • This client had a large collection of complex, interconnected data. We made a bespoke dashboard with connected maps and charts to provide valuable insight into the data.
  • Used Svelte, D3 and Tailwind together for the first time, can recommend!
Home owners project tool

Project tool for home owners

Prototype

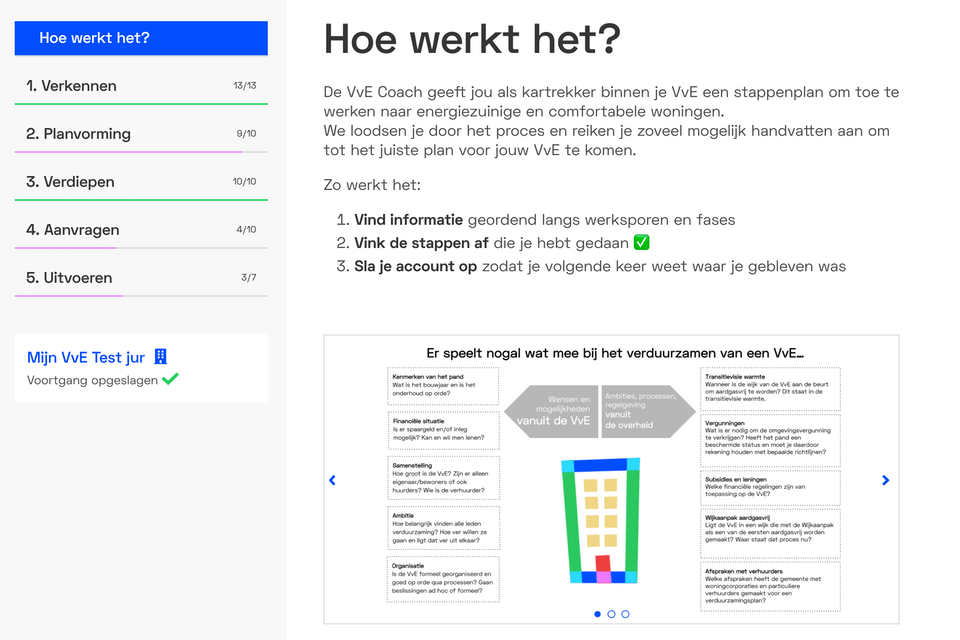
  • Organizational tool for home owners that would like to sustainably renovate their homes with the home owners association.
  • Personalized information for different types of associations.
  • Remembers the steps you took and allows for notes.
  • Simple CMS with Airtable.
  • Active on the Nieuw Amsterdams Klimaat website, ready for version 2.
Buurtcompost in Amsterdam thumbnail

Neighborhood compost in Amsterdam

Hobby project

  • Inspired by an interview with a data analyst working at the municipality of Amsterdam.
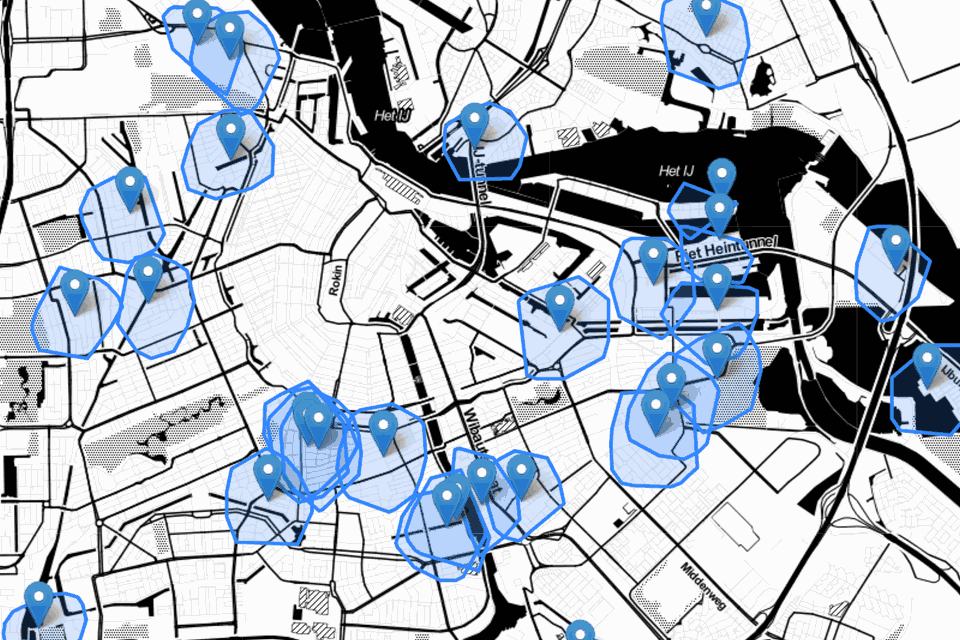
  • Script calculates the walking distance to the nearest wormhotel for all addresses in Amsterdam.
  • This way we can see where it might be handy to place more wormhotels.
  • Uses the routing engine OSRM and Open Route Service.
  • Can be used for other objects in Amsterdam, like pingpong tables, trash containers, pools, etc.
Social & Emotional Skills thumbnail

Social & Emotional Skills

The International Rescue Committee

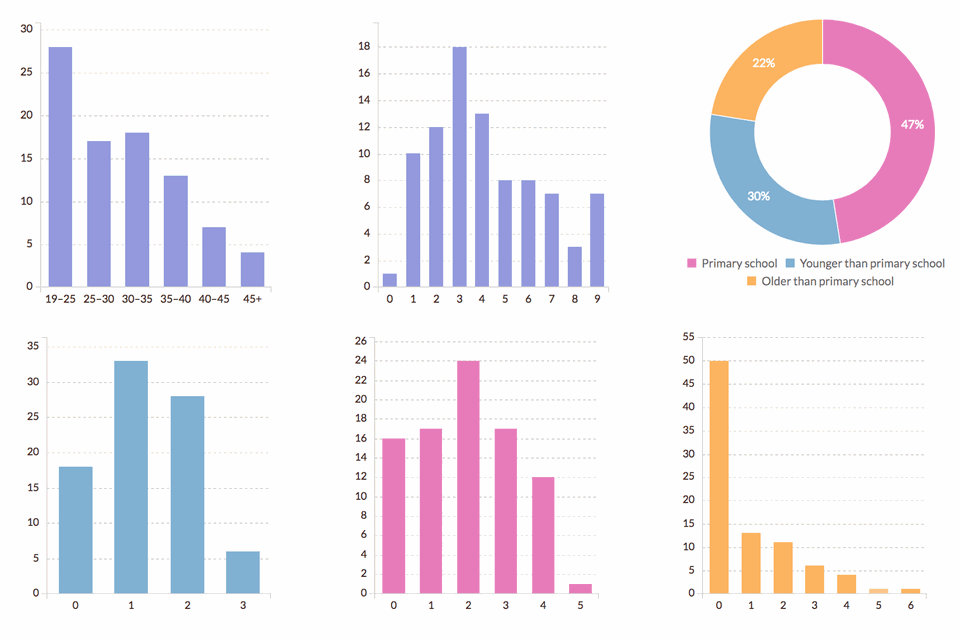
  • Analysis and visualization of qualitative data gathered by the International Rescue Committee in the refugee camp Nyarugusu, in Tanzania.
  • Built a data pipeline with Python / Pandas to calculate ratios and percentages.
  • Made visualizations with D3.js and Billboard.js.
  • Made a presentation template in HTML, CSS, and Python.
Network visualization thumbnail

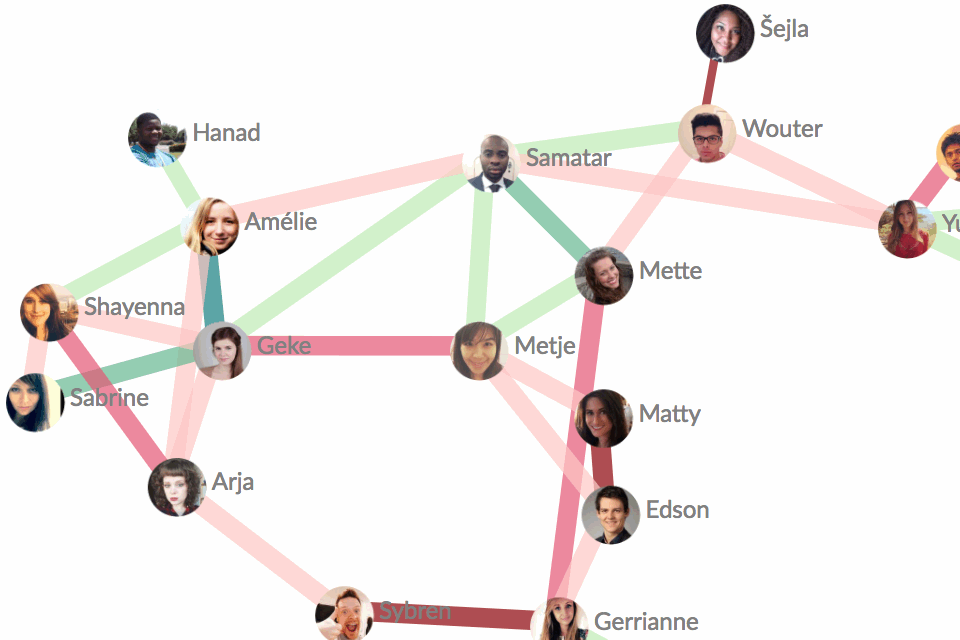
Interactive network graph

Prototype

  • Network graph showing average sentiment between characters in a TV show, derived from their dialogue across a chosen date range.
  • Made with D3.js and JavaScript.
The Internet Health Report thumbnail

The Internet Health Report

The Mozilla Foundation

  • Researched, collected and structured the underlying dataset for the first installment of Mozilla's annual Internet Health Report.
  • A design agency took the dataset through to the published report.